Time-Based Situational Overview in eOCS
From a snapshot to a temporal context
eOCS already offers comprehensive options for displaying static and dynamic content – from background and topographical maps to operations, operational resources and other object elements. This information provides a consistent situational picture, but in its traditional form remains tied to a specific point in time.
The ‘MUSIG’ research project adds a crucial dimension to this representation: time.
Map content can now be integrated as time-dependent layers, thereby enabling a continuous view of developments and changes.
Technical basis for time-dependent layers
A prerequisite for visualisation is the provision of the relevant data in a defined format. This data is integrated into eOCS as layers and can be specifically assigned to individual user roles.
When such a layer is activated, a time slider is automatically made available. This allows specific points in time to be selected and makes changes over time immediately visible. The map thus evolves from a static representation into a dynamic overview of the situation.
Case study: Visitor flows at the Danube Island Festival
The Danube Island Festival in Vienna, which attracts around 2.5 million visitors, provides a clear example. The visualisation shows not only the current crowd density but also how it changes over the entire duration of the event.
Navigating through time reveals patterns: areas become congested, visitor flows shift, and pressure eases. Critical situations – such as locally increased crowd density – can be identified and assessed at an early stage.
Support for dynamic operational situations
The visualisation of time-dependent data opens up a wide range of applications. Wherever situations are constantly changing, this provides significant added value. Examples include:
- Changes in water levels in flood-prone areas
- The spread of hazardous substances in industrial facilities
- Movement patterns at gatherings or demonstrations
By placing events in a temporal context, developments become not only visible but also interpretable.
Added value for decision-making processes
The integration of time-dependent data into the map component creates a sound basis for operational decisions. Users benefit from:
- improved assessment of situational developments
- early detection of critical trends
- greater transparency regarding temporal relationships
- more targeted planning and management of measures
This makes the map more than just a visualisation tool. It becomes a central element of situational awareness, depicting not only the current state but also its origins and subsequent developments.
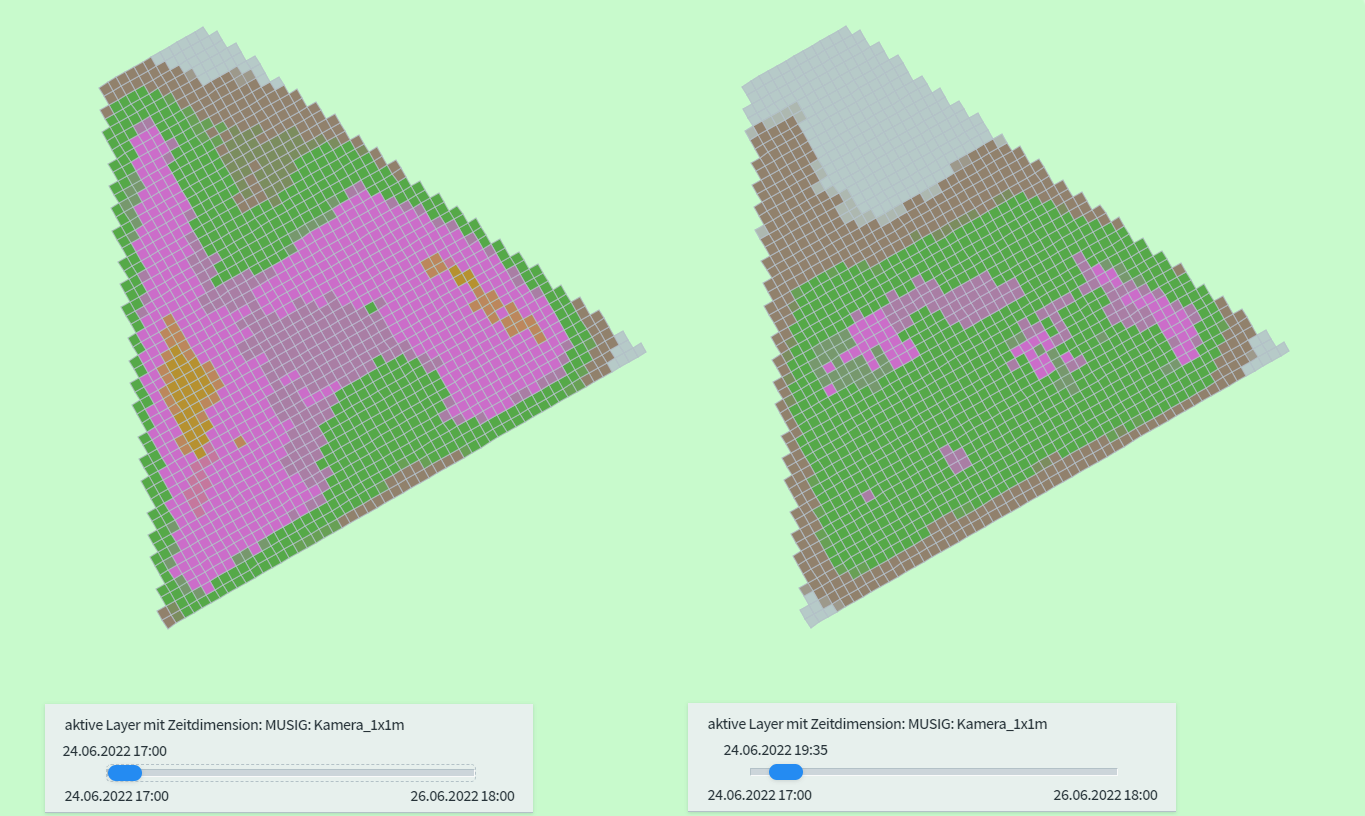
Time-lapse view of the situation.